
What’s attracting users to the Google platform is the idea of democratized data and the attribution modeling tool I think is one of the best examples. Previously if you looked at attribution modeling this was available to only the biggest brands with very large budgets and now Google has taken this tool to be a part of the free version.
It still takes some savvy marketers to really apply this well and my goal today is to give you a good start into how the tool works and how you may get started down this path. We’re going to take a look at the tools in Google Analytics that you can use to measure the conversion and to visualize the conversion journey.
Some of the primary purposes of analytics and measurement here is to help us understand what is really happening as we go through this journey of a conversion and how we can measure that.
Multichannel Funnels
It allows us to take that progression, that journey and start from the conversion and go backwards. What was the last thing that happened before the conversion, what was the thing that happened before that and before that before that and how far back we go is known as the look-back window i.e. how many days back from the conversion we want to look back.
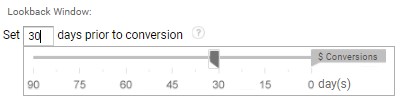
The default is going to be 30 days, you can do it up to 90 days back via Google and this is something you wanna experiment with. I encourage people to use look-back windows that master sales cycle, and at the same time challenge your assumptions. Do you really know what your sales cycle is? Does the data that you see in the account really match with what you think?
We also look at the different channel groups and groups are important because otherwise we could have a case where we have 10,000 visitors and they could take 10,000 paths. If we get too specific about these individual campaigns and keywords, you can end up losing the overall trend and not being able to kind of see highly visible trends.
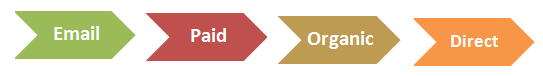
Channel groupings are great because they allow us to extract information in two basic buckets where we can start to see what those trends are and are you progressing from email -> paid search -> organic -> direct and then we can dive down into the individual ones as needed. But it’s good idea to set up channel groups, the last interaction that happened right before you converted and everything else before that is an assisting channel.
So coming back to this idea of assists, everything here prior to “direct” are the assists and we think about how we visualize this. There’s four main things that we want to think about on this,
- We want to think about of course the conversion and the channels that were involved
- We also want to think about how much time it took to get through that funnel
- We want to think about how many touches and touch points there were going through the funnel
- What was the sequence, who are the exposures, who are the closers and who are those supporters in the middle that keep things moving
Everyone has their role and our model may value some more than others, but the first step is simply understanding who are the individual channels, how do they perform individually before we can put it altogether and see how they work together. Multi-channel funnels, it’s a place to look at those individually and understand the sequence, how much time it took and how many touches there are now.
In the multi-channel funnel reports, we’ve got the overview, we’ve got a few different breakdowns,
- The assisted conversions is what we discussed above
- The path length is going to give us some sense of how many touches there were and how long it took to get through is going to refer to that sales cycle
- The time lag give us the number of days it took from the first interaction to conversion
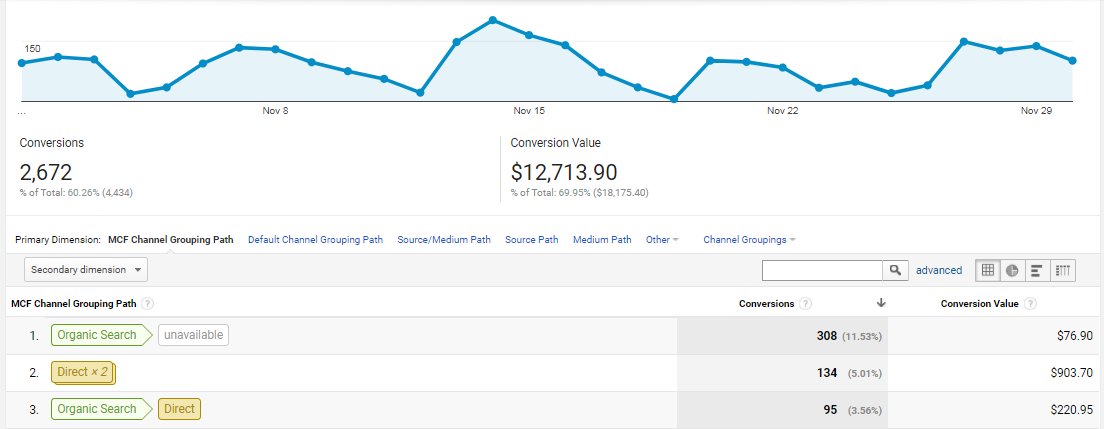
Let’s take a quick look at the interface, at how we would take a look at these and I want to show you one of my favourite quick reports through here to get to multi-channel funnels. We simply come down here to conversions > multi-channel funnels and if we look through the top conversion path, this is the one that we’ve use to visualize what those different channels are that come through here.
We see the different channel groupings here and how those interact with each other and what that sequence looks like. You can set the date range at the top and you can also set that look-back window through here, you can also set which type of conversions you want to be tracking and a few other ways to qualify this data through here.
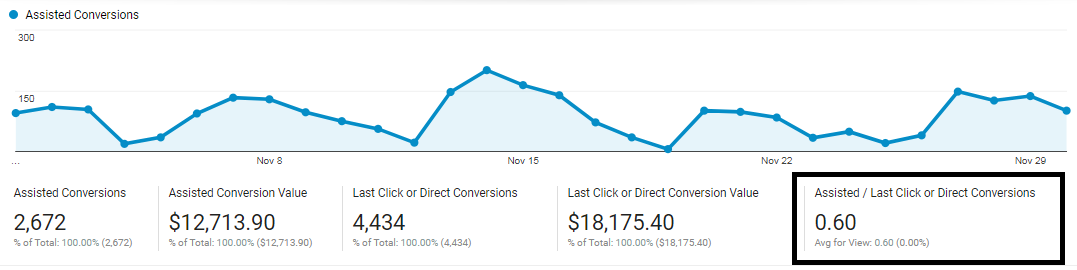
But what I want to also point your attention to is this idea of assisted conversions and metric that I really like and that is over on the far right hand side. Here is this ratio assisted conversion versus last click or direct conversions, assisted is the numerator and last click is the denominator.
Google Analytics is going to show you your business. The beauty is Google actually knows a lot because Google has millions and millions of Google Analytics accounts and what it can do is show you how you compare baseline to other folks.
Author bio: A passion for always being on the cutting edge of SEO developments, web analytics has ignited a desire in Himanshu to educate others on the tips of digital marketing. Himanshu Suri is the Founder of Times24by7, an internet marketing company specializing in providing SEO services.